 RatedDays
Year in Pixels: The Complete Guide to Coloring In Your Year
A year in pixels is the simplest long-term tracker there is: one small square for every day of the year, colored in each evening based on how that day went. It takes about ten seconds a day. By the end of the year you have something no diary gives you, a single picture of all 365 days at once.
This guide covers how it works, how to set one up on paper or on your phone, color keys you can copy as they are, what to do with the finished grid, and the mistakes that make people quit by March.
What is a year in pixels?
The layout is usually credited to Camille of @passioncarnets, and it spread through the bullet journal community from there. The idea is plain: a grid with 12 columns (months) and 31 rows (days), or the other way around. Each square is a "pixel." Every night you pick one color from a key that sums up the day.
One pixel per day is the whole point. You will have mixed days, with a stressful morning and a lovely evening, and the tracker asks you to step back and judge the day as a whole. That small act of stepping back is half the value. Days often feel worse in the moment than they look an hour later.
What you get at the end:
- Streaks and slumps. A run of gray in February jumps out in a way a written diary never would.
- Seasonal patterns. Many people see their winters and summers look different.
- Proof. When a hard month makes you feel like the whole year was bad, the grid shows you what actually happened.
If you want to track more than one thing per day, mood plus sleep plus exercise, see our mood tracker ideas. A year in pixels works best when it tracks one thing well.
How to set up a year in pixels on paper
You need a notebook (dot grid is easiest), a ruler, a fine pen and 5 colored pens or pencils.
- Draw the grid. 12 columns labeled J F M A M J J A S O N D across the top, and 31 rows numbered down the side. Squares of 4 to 5 mm fit on one A5 page.
- Cross out days that don't exist. February 29 to 31 (or 30 to 31 in a leap year), and the 31st of April, June, September and November. Do this now so you never color a phantom day.
- Draw the key. Put it under the grid or on the facing page. Color a sample square next to each label.
- Test your pens. Color one square of each in the back of the notebook to check they don't bleed through.
- Pick a time. Tie it to something you already do every night: brushing your teeth, plugging in your phone, the last episode of whatever you're watching.
Leave a little space under the grid or on the facing page for one-line notes on standout days ("got the job," "flu"). Without them, you will look at a dark red square in June and have no idea why.
How to make a digital year in pixels
Digital is easier to keep up because the grid is always in your pocket and doesn't need pens.
Spreadsheet. In Google Sheets or Excel, make 12 columns and 31 rows, then type a number (1 to 5, or 0 to 10) in each cell. Add conditional formatting that colors each number. This gives you free averages per month, but you have to remember to open the file.
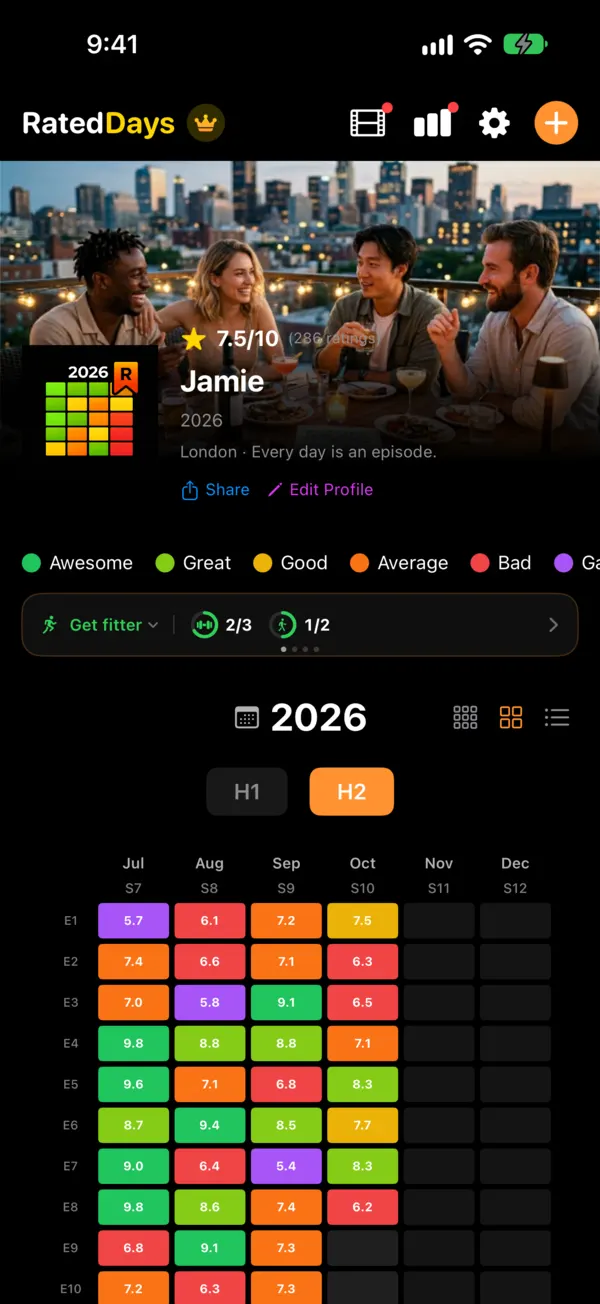
An app. Many mood and journal apps have a year view. If you already rate your day with a number, a daily 0 to 10 rating can feed the grid directly, so you never choose a color at all.
That's how the home screen of Rated Days works: you rate the day from 0 to 10, and the square on your year grid colors itself. The colors and the rating ranges behind them can be changed to match your own key.
Year in pixels color key ideas (ready to copy)
The key is where most trackers go wrong, so here are four that work. Copy one exactly, then adjust after a month if it feels off.
1. The classic 5-mood key
Good if you want to track how you felt.
| Color | Meaning |
|---|---|
| Dark green | Amazing day |
| Light green | Good day |
| Yellow | Average, nothing special |
| Orange | Rough day |
| Red | Really bad day |
2. The 0 to 10 day-rating key
Good if you like numbers, or want averages at the end. Rate the whole day, then color by range.
| Rating | Color | What it usually means |
|---|---|---|
| 9.0 to 10 | Deep green | A day you'll remember |
| 7.5 to 8.9 | Green | Genuinely good |
| 6.0 to 7.4 | Light green | Fine, a bit better than normal |
| 4.5 to 5.9 | Yellow | Flat or mixed |
| 3.0 to 4.4 | Orange | Hard |
| 0 to 2.9 | Red | One of the worst |
Notice the ranges aren't equal. Most people's ordinary days land between 5 and 7, so the key spends more colors there, where the detail is. Our guide to the 1 to 10 mood scale has descriptions for each number if you want anchors.
3. The energy key
Good if mood is hard to pin down but tiredness isn't.
- Blue: drained, could barely function
- Light blue: low, running on fumes
- Gray: normal
- Light orange: good energy
- Orange: buzzing, got loads done
4. The one-color shading key
Good if you want a calm, minimal page. Use one pen and shade by intensity: empty for a bad day, dotted for low, half-filled for okay, fully filled for good, filled plus outlined for great. It looks beautiful in black ink and photocopies well.
Rules that make any key work
- Five to seven colors, no more. If choosing takes longer than a few seconds, you'll stop.
- Order colors in a gradient. Warm-to-cool or dark-to-light lets you read the year at a glance. A rainbow key with random order turns into confetti.
- Keep "average" neutral. Yellow or gray, so the good and bad days stand out against it.
- Never change the key mid-year. If you must, start a fresh grid from that month.
What to do with your year in pixels at the end of the year
A finished grid is pretty. It becomes useful when you spend twenty minutes with it.
- Count your colors. How many great days? How many bad ones? Write the totals down. Most people are surprised by how many ordinary days there are, and how few truly bad ones.
- Find your best and worst month. Look for the block with the most green and the most red. What was going on?
- Look for streaks. A run of five or more good days in a row, and the longest low patch. Streaks tell you more than single days.
- Check the days of the week. If you used a digital grid, compare weekdays and weekends. On paper, look across rows for Mondays.
- Read your notes for the extremes. The notes beside your best ten days are a list of what to do more of.
- Write three sentences. What lifted the year, what dragged it, what you'll change. That's your year in review, half written already.
- Keep it. Photograph the page or export the data. Next December, you can compare two years side by side.
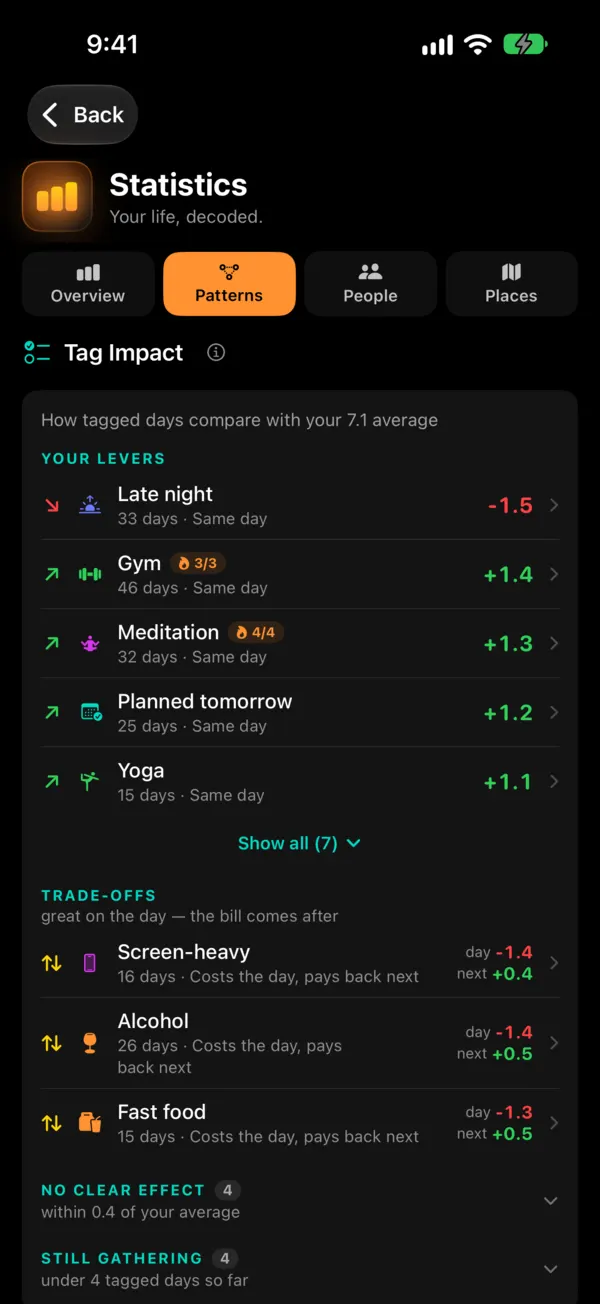
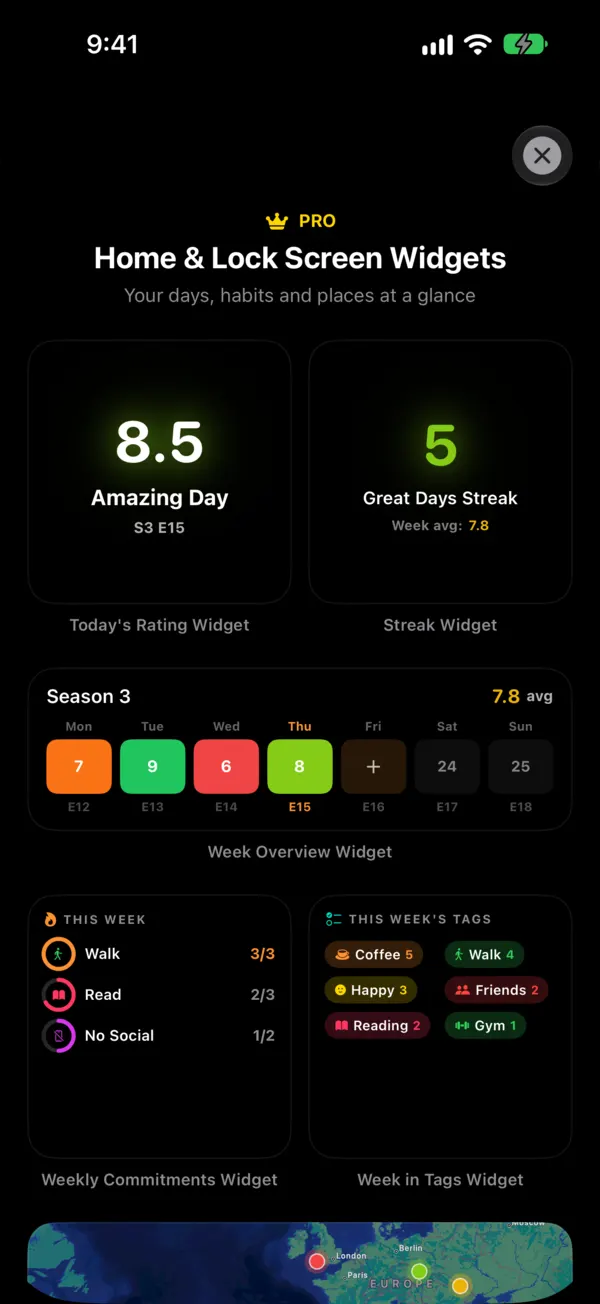
In Rated Days, the year grid is also on your Home Screen as the "Your Year in Episodes" widget, and the statistics view shows which tags and people show up on your best and worst days, which is the step-5 work done for you.
Common year in pixels mistakes
Too many colors. Ten moods with ten colors looks lovely in the key and is painful to use. Every night becomes a decision about whether you were "content" or "calm." Cut it to five.
Coloring the worst moment instead of the day. A 20-minute argument shouldn't turn a mostly good day red. Ask, "Taken as a whole, how was today?"
Backfilling a whole week from memory. After two or three days, you're guessing, and guesses drift toward average. Leave real gaps blank.
No notes at all. Colors tell you when; a few words tell you why. One word on standout days is enough.
Giving up after a bad patch. A run of red is exactly what the tracker is meant to show. Keep coloring; the recovery is part of the picture.
Treating it as a test. There's no score to beat. A grid full of yellow is an honest year, not a failed one.
A note on mood tracking: a year in pixels can help you notice patterns, but it isn't a substitute for professional help. If a long stretch of dark squares matches how you feel, talk to a doctor, or in the US call or text 988 to reach the Suicide & Crisis Lifeline.
Start tonight, not in January
You don't need to wait for a new year. Draw the grid or open an app, choose a key from above, and color today's square before bed. The first square is the only one that takes any thought. After that, it's ten seconds a night, and in December you get to see your whole year at once.
Frequently asked questions
How many colors should a year in pixels have?
Five is the sweet spot for most people: enough to separate a great day from a fine one, few enough that you can decide in a few seconds. If you rate days on a number scale, you can use more shades of the same few colors, as long as each shade maps to a clear range of numbers.
What if I miss a day in my year in pixels?
Fill it in the next morning if you remember the day well. If you don't, leave it blank or mark it with a dot. Don't guess a color for a week you can't recall; an honest gap is more useful than invented data, and the habit matters more than a perfect grid.
Should a pixel show my mood or my whole day?
Decide once and stick to it. Mood asks how you felt; a day rating asks how the day went overall, which includes events, people and energy. Many people find rating the whole day easier, because one bad hour doesn't have to define the square.
Can I start a year in pixels in the middle of the year?
Yes. Start today and leave earlier squares blank, or begin a rolling 12-month grid from this month. A half-year grid is still a full picture of those months, and starting in November or December gives you a practice run before January.
Is there a year in pixels app?
Several apps offer it. Rated Days, a free iPhone app, shows your year as a color grid on its home screen and in a Home Screen widget: you rate each day from 0 to 10 and the square colors itself, with colors and rating ranges you can personalize.